Table of Contents
Enriched subnetwork analysis
You can also perform subnetwork analysis (Beisser (2010), Dittrich MT (2008)) to extract the subnetwork enriched with nodes which are associated with a significant phenotype using HTSanalyzeR2. The network can either be fetched by our package to download specific species network from BioGRID database or defined by users.
Prepare input, initialize and preprocess
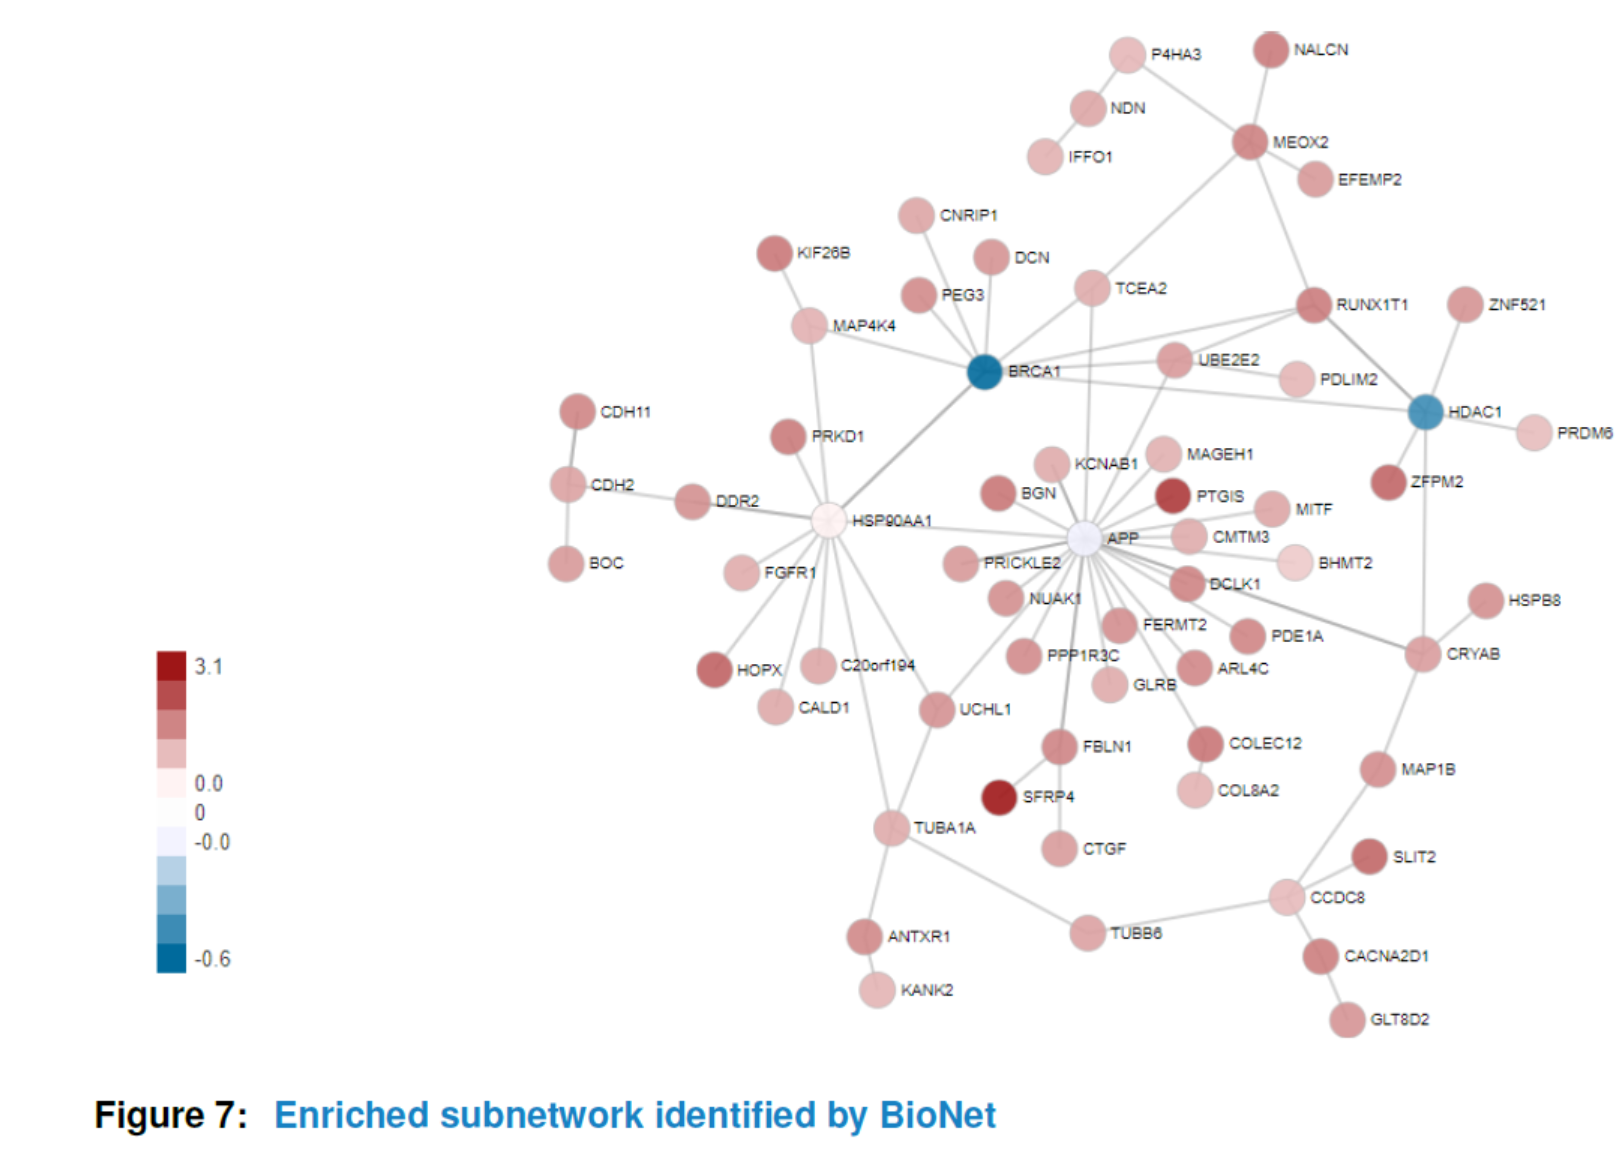
An S4 class named ‘NWA’ is developed to perform subnetwork analysis. To initiate an ‘NWA’ object, you need to prepare a named numeric vector called ‘pvalues’. If phenotypes for genes are also available, they can be inputted in the initialization step and used to highlight nodes with different colors in the identified subnetwork. In that case, the nodes are colored by the sign of phenotypes (red:+, blue:-).
When creating a new object of class ‘NWA’, the user also has the possibility to specify the parameter ‘interactome’ which should be an object of class ‘igraph’. If it is not available, the interactome can also be set up later.
pvalues <- GSE33113_limma$adj.P.Val
names(pvalues) <- rownames(GSE33113_limma)
nwa <- NWA(pvalues=pvalues, phenotypes=phenotype)
The next step is to preprocess the inputs. Similar to ‘GSCA’ class, the function preprocess can conduct invalid input data removing, duplication removing by different methods and initial gene identifiers converting to Entrez ID.
nwa1 <- preprocess(nwa, species="Hs", initialIDs="SYMBOL",
                   keepMultipleMappings=TRUE, duplicateRemoverMethod="max")
Then, you need to create an interactome for the network analysis using method interactome if you have not inputted your own interactome in the initial step. To this end, you can either specify the species and fetch the corresponding network from BioGRID database, or input an interaction matrix if it is in right format: a matrix with a row for each interaction, and at least contains the three columns “InteractorA”, “InteractorB” and “InteractionType”, where the interactors are specified by Entrez ID. For more details please see help(interactome).
Here, we just use interactome to download an interactome from BioGRID, which would meet user’s requirements in most cases.
nwa2 <- interactome(nwa1, species="Hs", genetic=FALSE)
getInteractome(nwa2)
Perform analysis and view the identified subnetwork
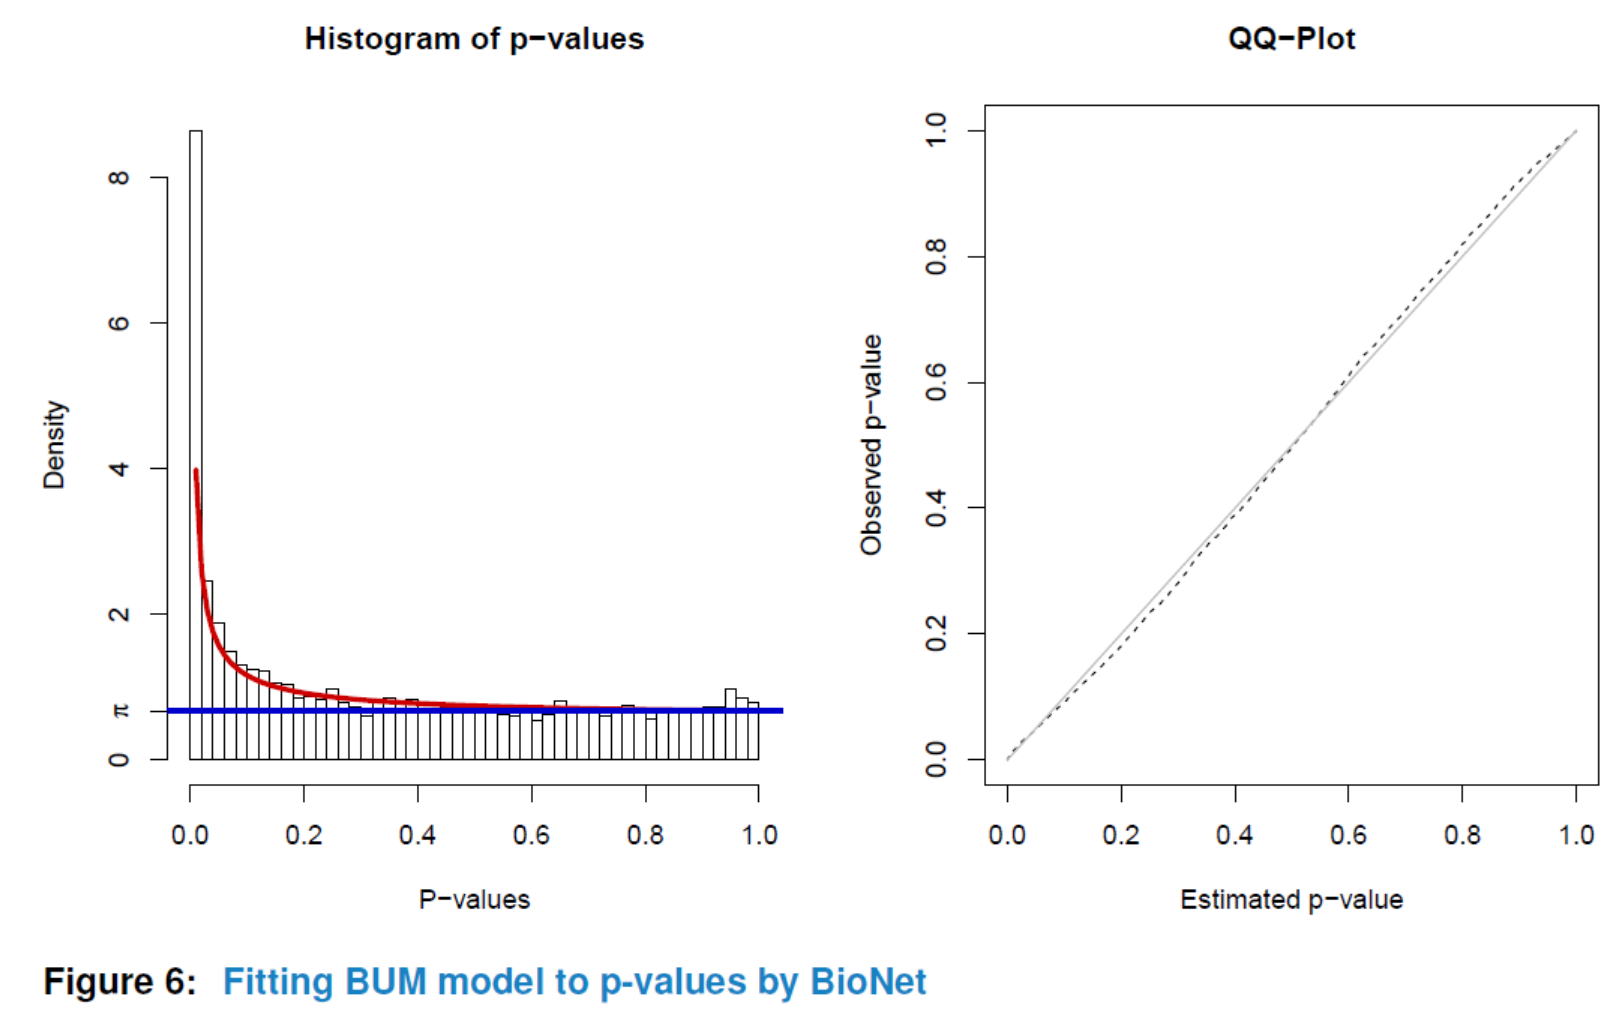
Having preprocessed the input data and created the interactome, the subnetwork analysis could be performed by using the analyze method. This function will plot a figure showing the fitting of the BioNet model to your distribution of pvalues (Beisser (2010)), which is a good way to check the choice of statistics used in this function. The argument fdr of the method analyze is the false discovery rate for BioNet to fit the beta-uniform mixture (BUM) model. The parameters of the fitted model will then be used for the scoring function, which subsequently enables the BioNet package to search the optimal scoring subnetwork. See BioNet for more details (Beisser (2010)).
Here, to simplify this vignette, we set a very strict ‘fdr’ as 1e-06. In practice, you may want to set a less strict one (e.g. 0.01).
nwa3 <- analyze(nwa2, fdr=1e-06, species="Hs")
Similar to ‘GSCA’, you can also view the subnetwork by viewSubNet. Again, for better visualization, modification and downloading, users are highly recommended to view the result in an interactive Shiny report by function report.
viewSubNet(nwa3)
Summarize results
Like ‘GSCA’, the method summarize could also be used to get a general summary of an analyzed ‘NWA’ object including inputs, interactome, parameters for analysis and the size of identified subnetwork.
summarize(nwa3)
##
## -p-values:
##               input          valid     duplicate removed
##               21656          21655       21655
## converted to entrez in interactome
##               18865          15008
##
##
## -Phenotypes:
##                input          valid    duplicate removed
##                21656          21655      21655
##  converted to entrez  in interactome
##                18865          15008
##
##
## -Interactome:
##                 name    species genetic  node No  edge No
## Interaction dataset Biogrid Hs    FALSE   22439    332134
##
##
## -Parameters for analysis:
##             FDR
## Parameter 1e-06
##
##
## -Subnetwork identified:
##           node No   edge No
## Subnetwork     81   113